Report · ₹199
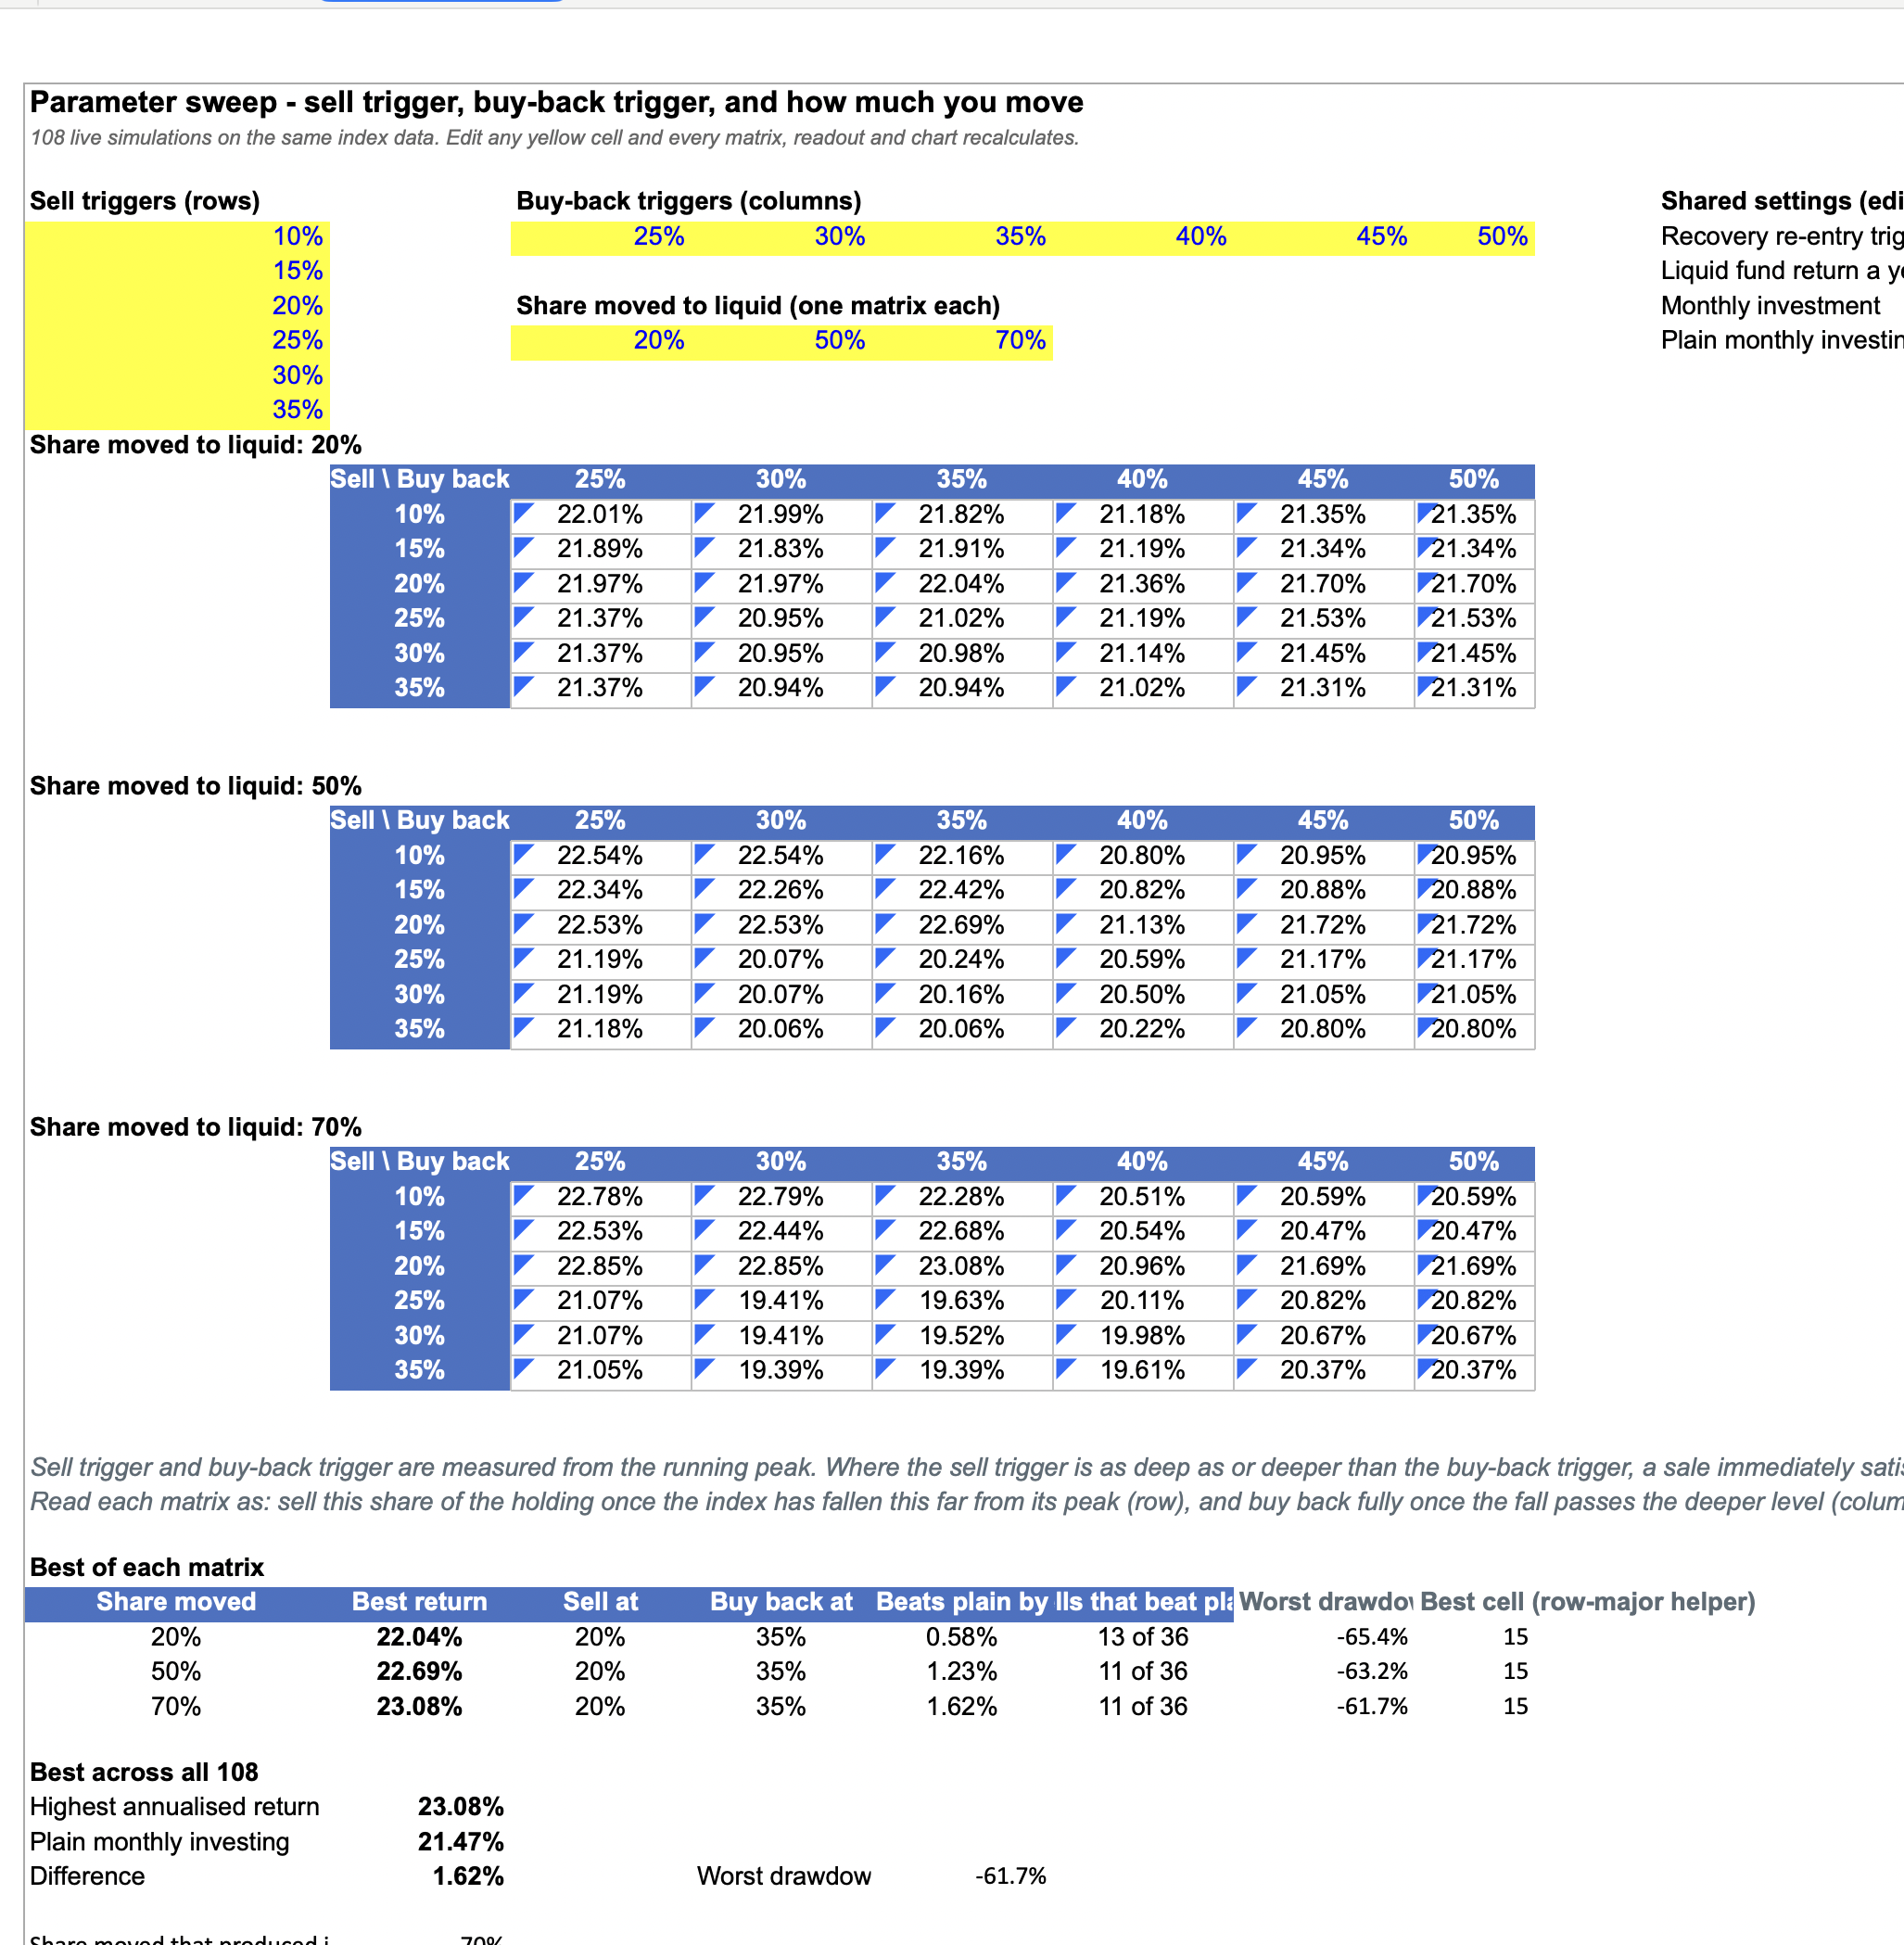
Nifty 50 — 108 strategies, backtested
21 years of real Nifty 50 data. One question: is it better to step aside in a fall, or just stay invested?
Return, per year
Worst fall
Report · ₹199
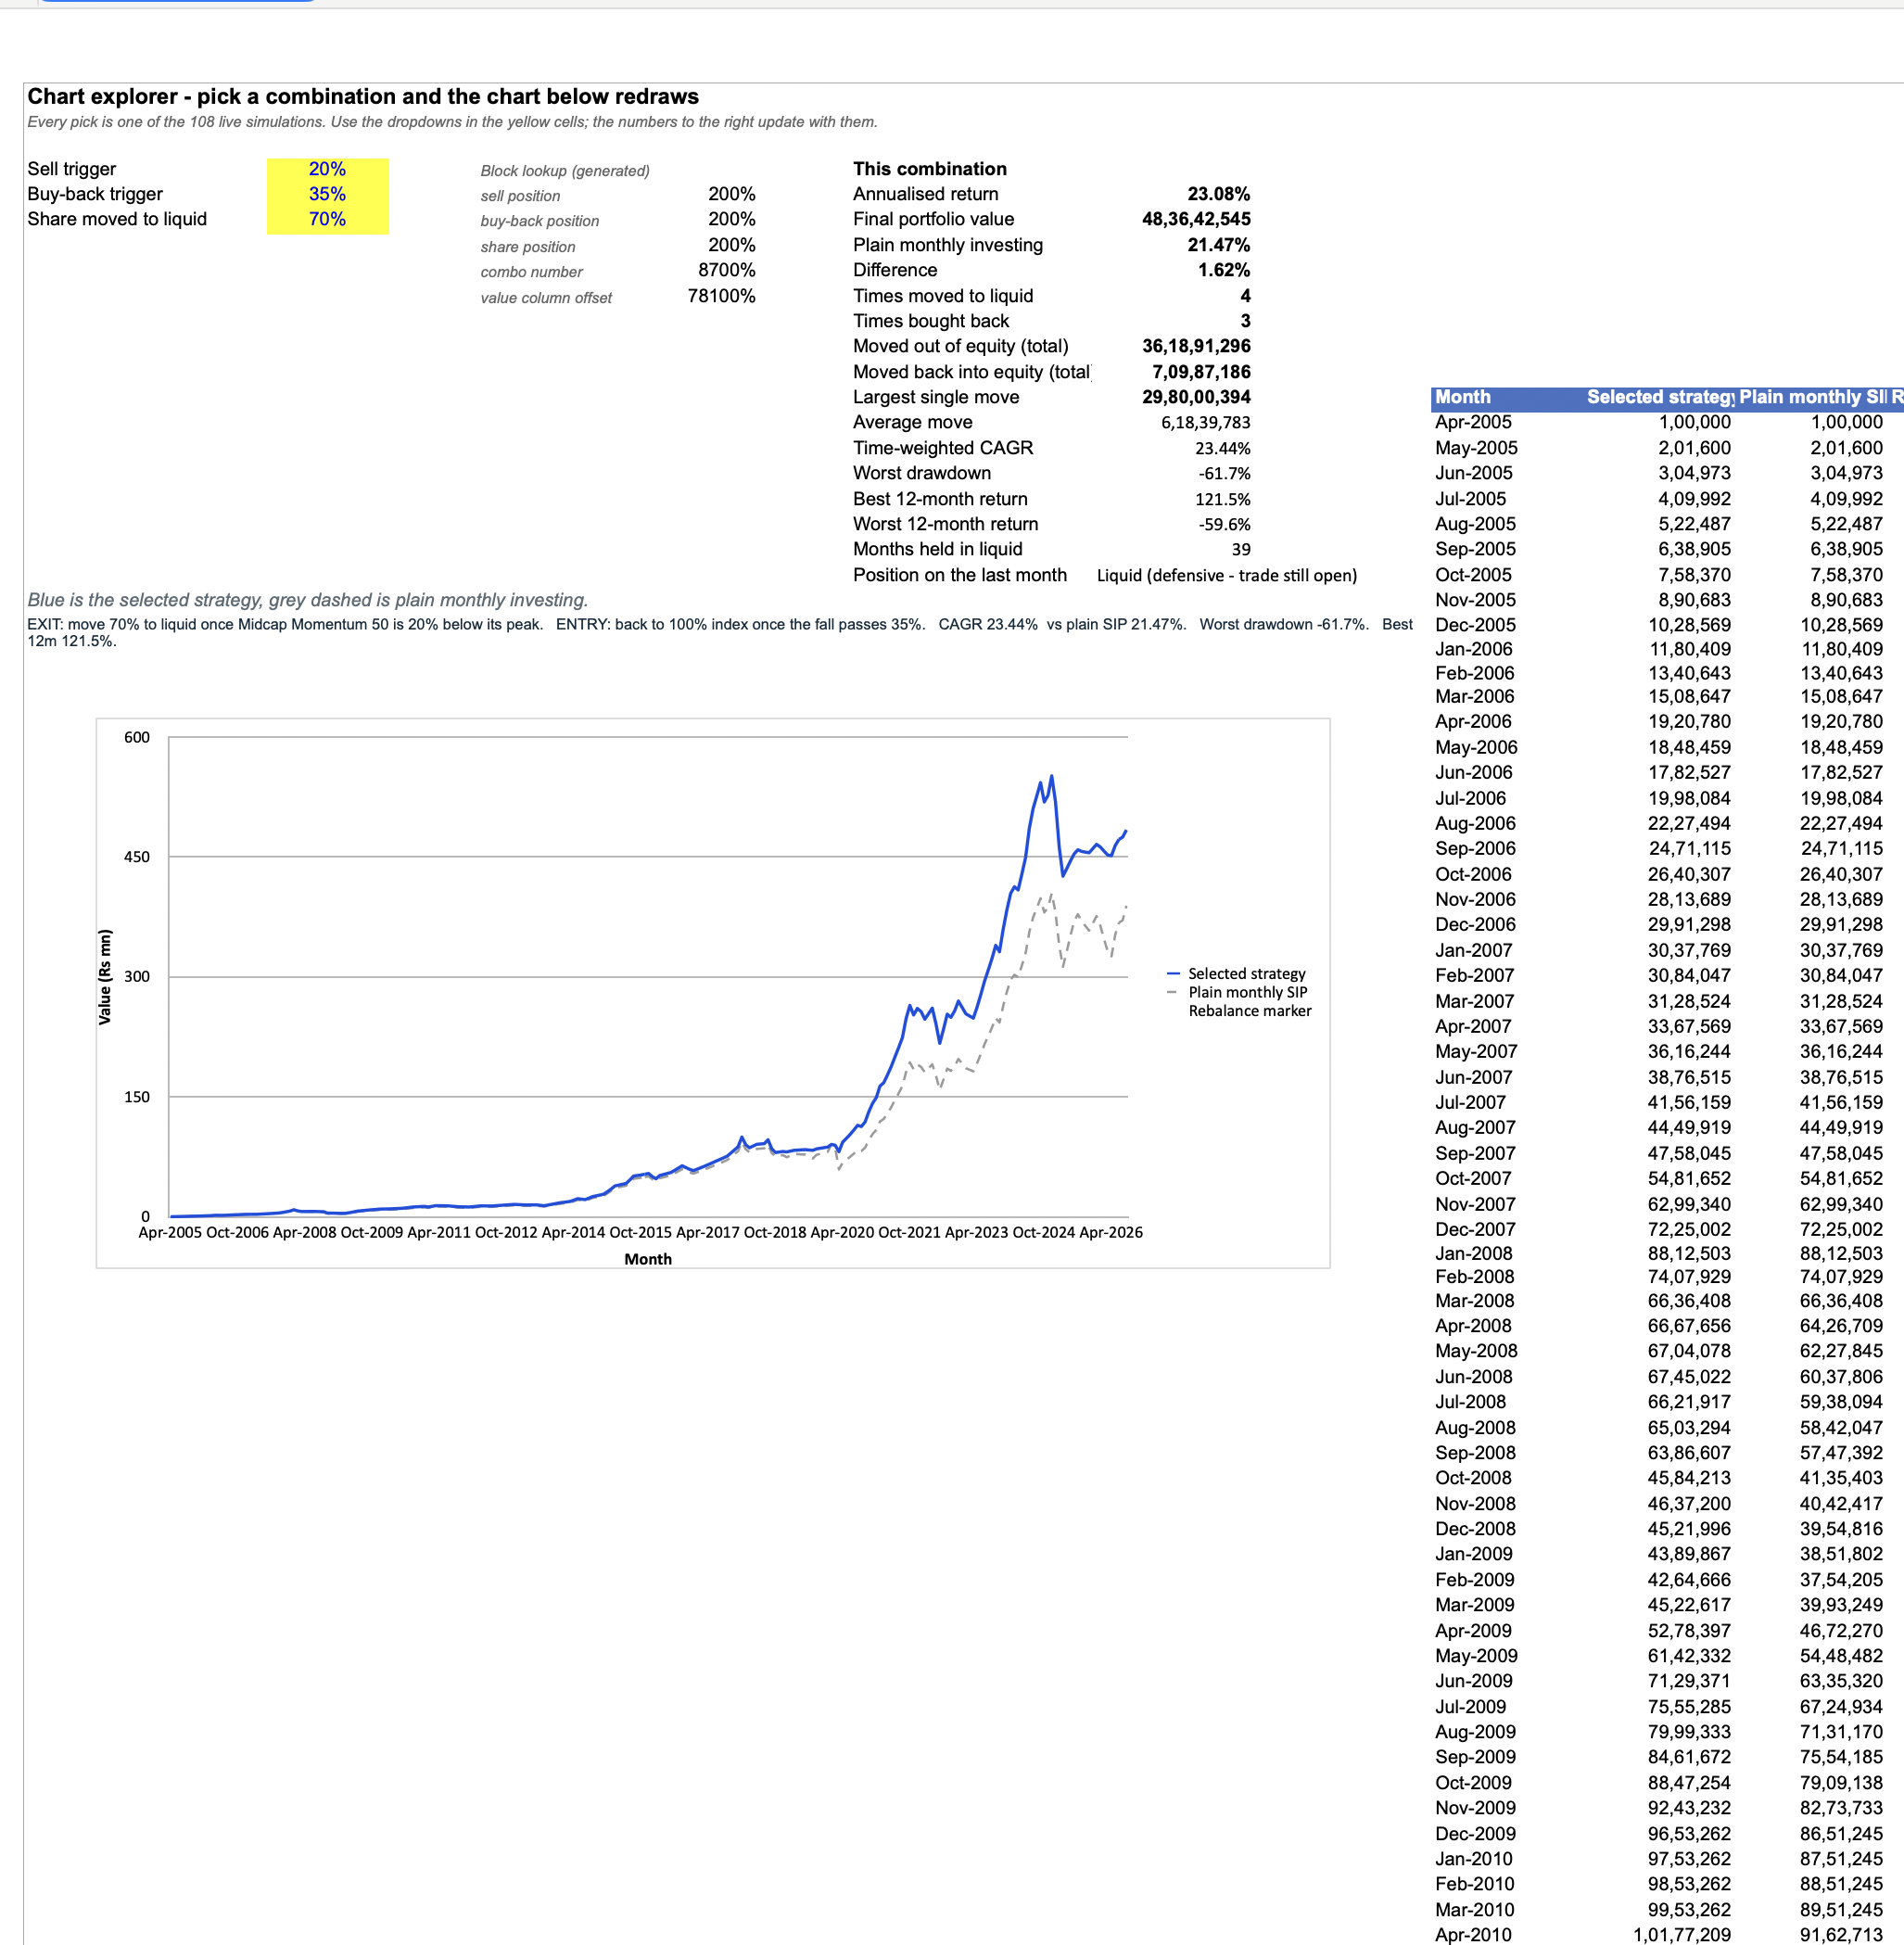
Midcap Momentum 50 — 108 strategies, backtested
The same 108 tests on midcaps, where the falls are deeper and timing matters more.
Return, per year
Worst fall
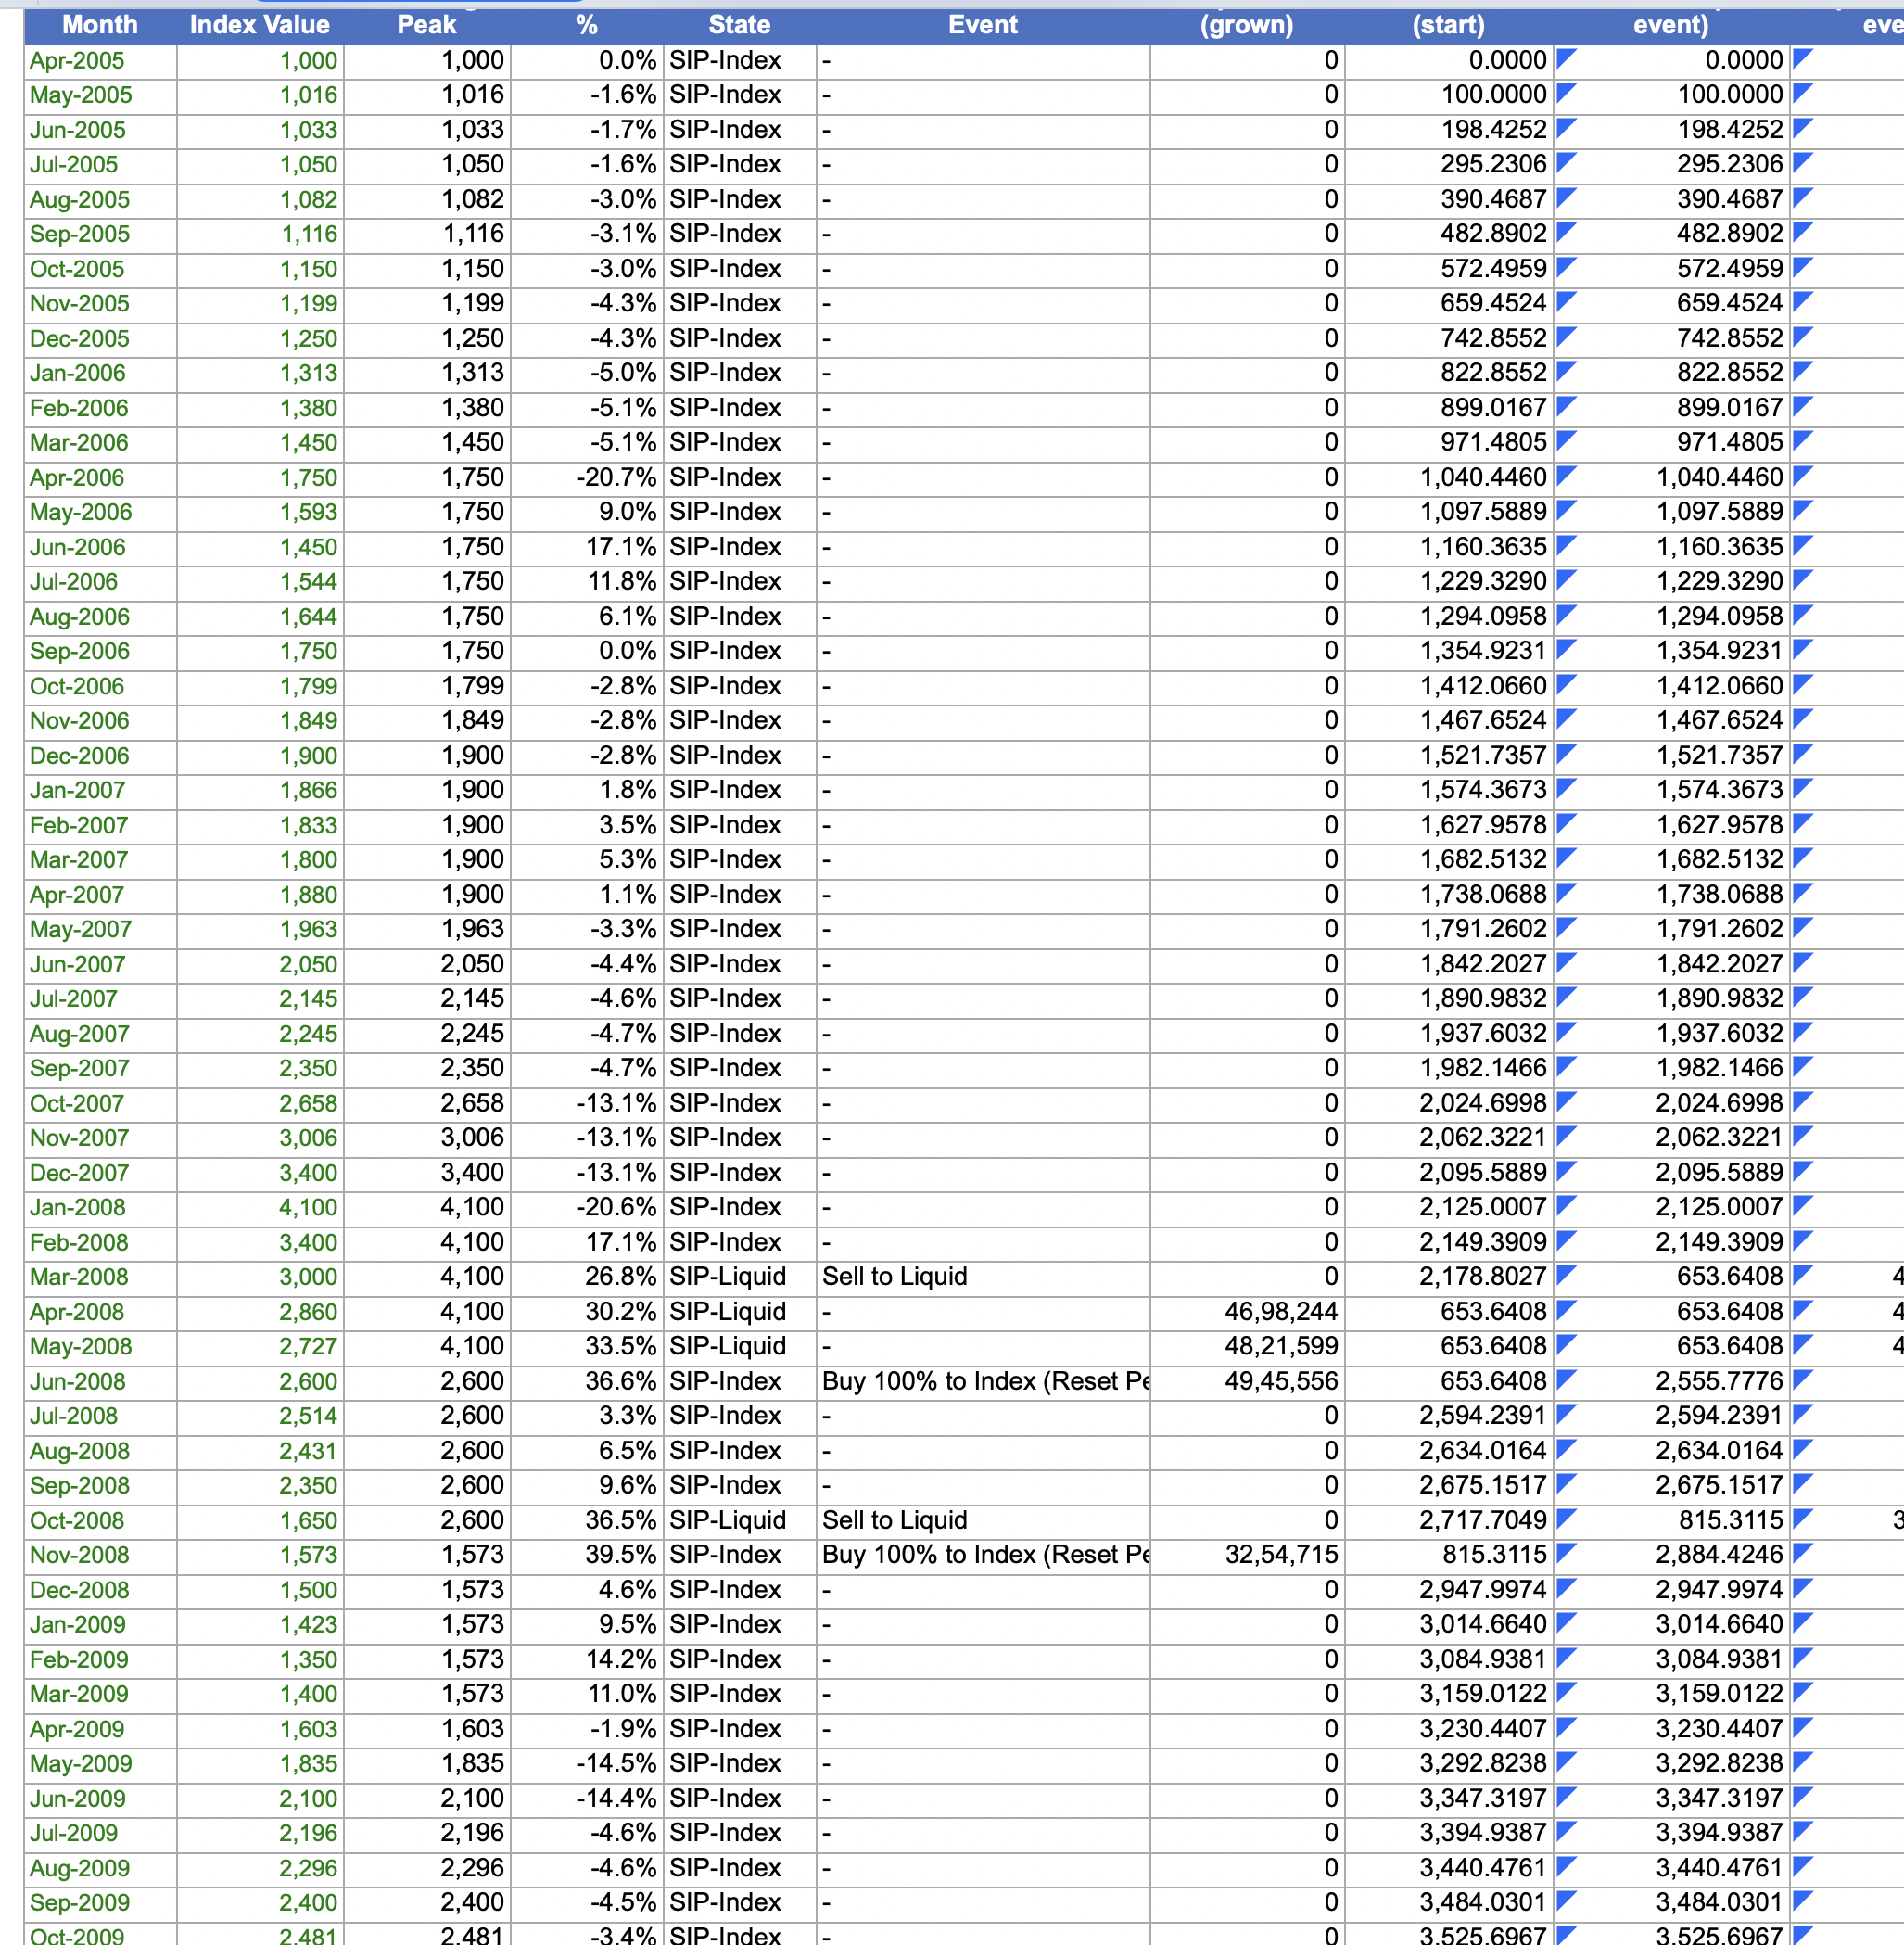
Screenshots show the Midcap Momentum 50 edition — both reports use the same layout, with each index's own numbers.
Read the numbers above carefully. These are backtests on one stretch of
history — what already happened, not what will. Most of the extra return came from a
handful of months, and two thirds of the versions tested did worse than simply staying
invested. Past returns do not guarantee future returns. This is educational material, not
advice — please speak to a SEBI-registered advisor before acting on any of it.