Get it
The complete simulator
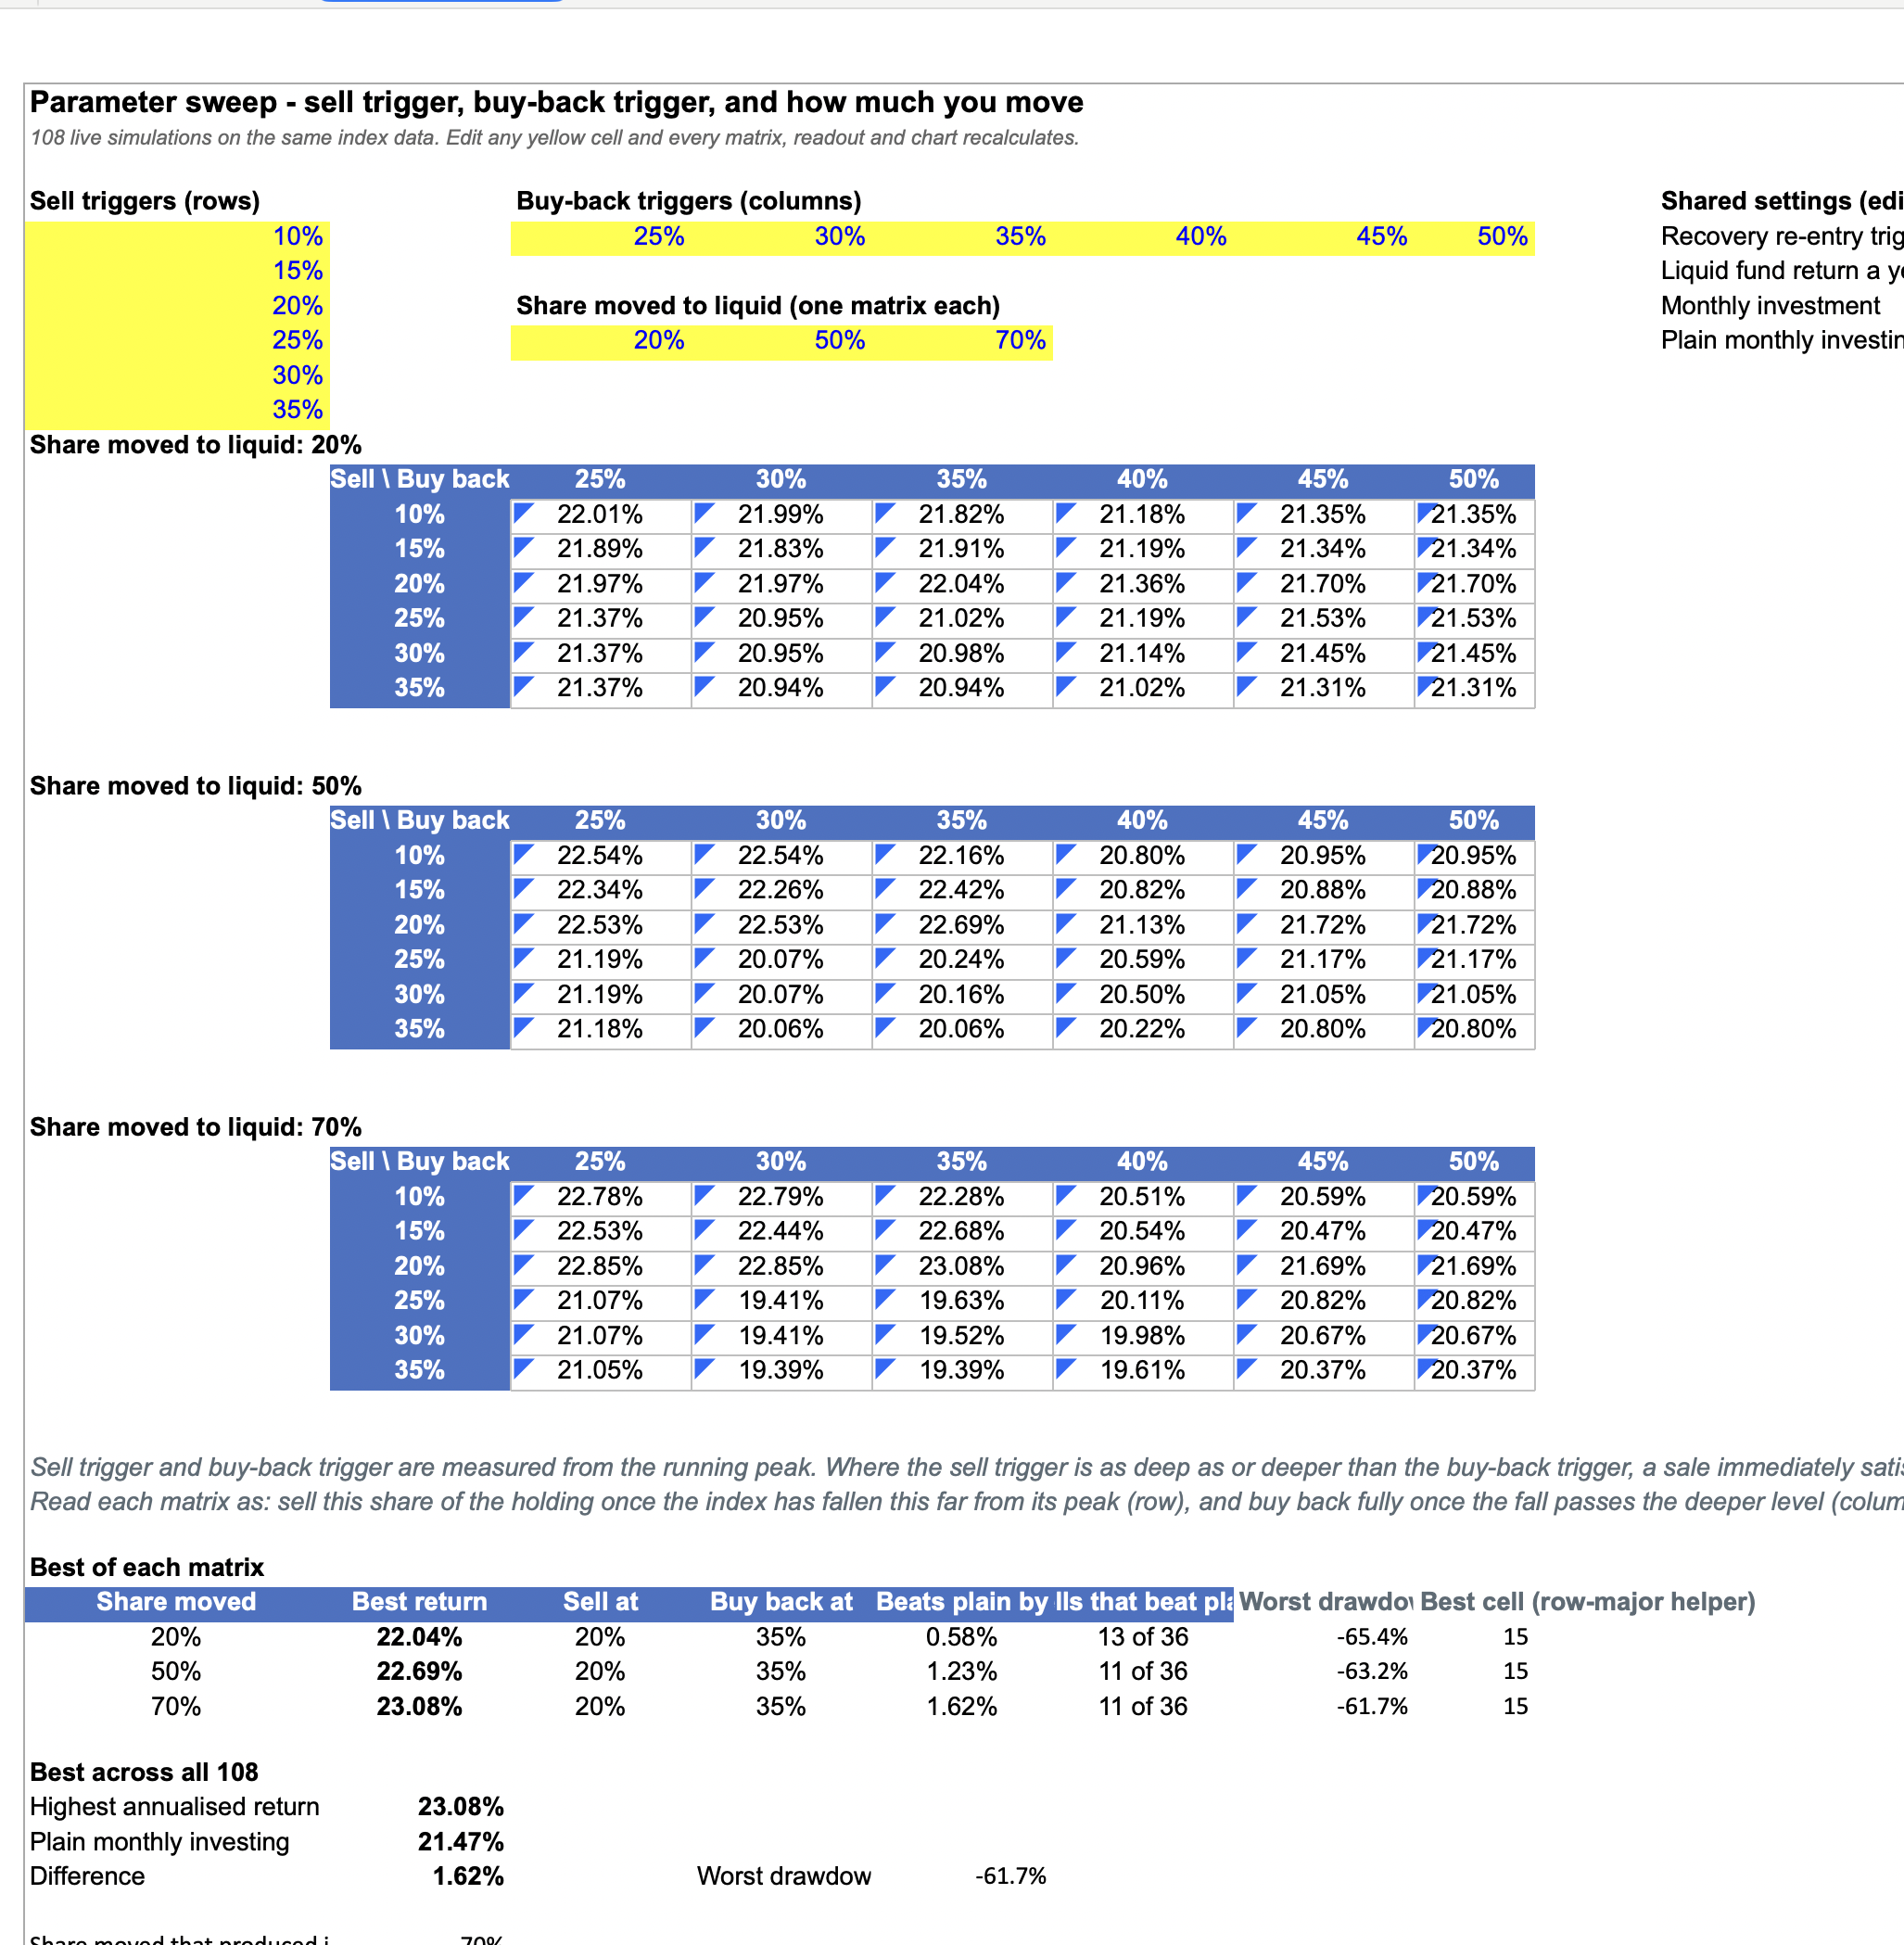
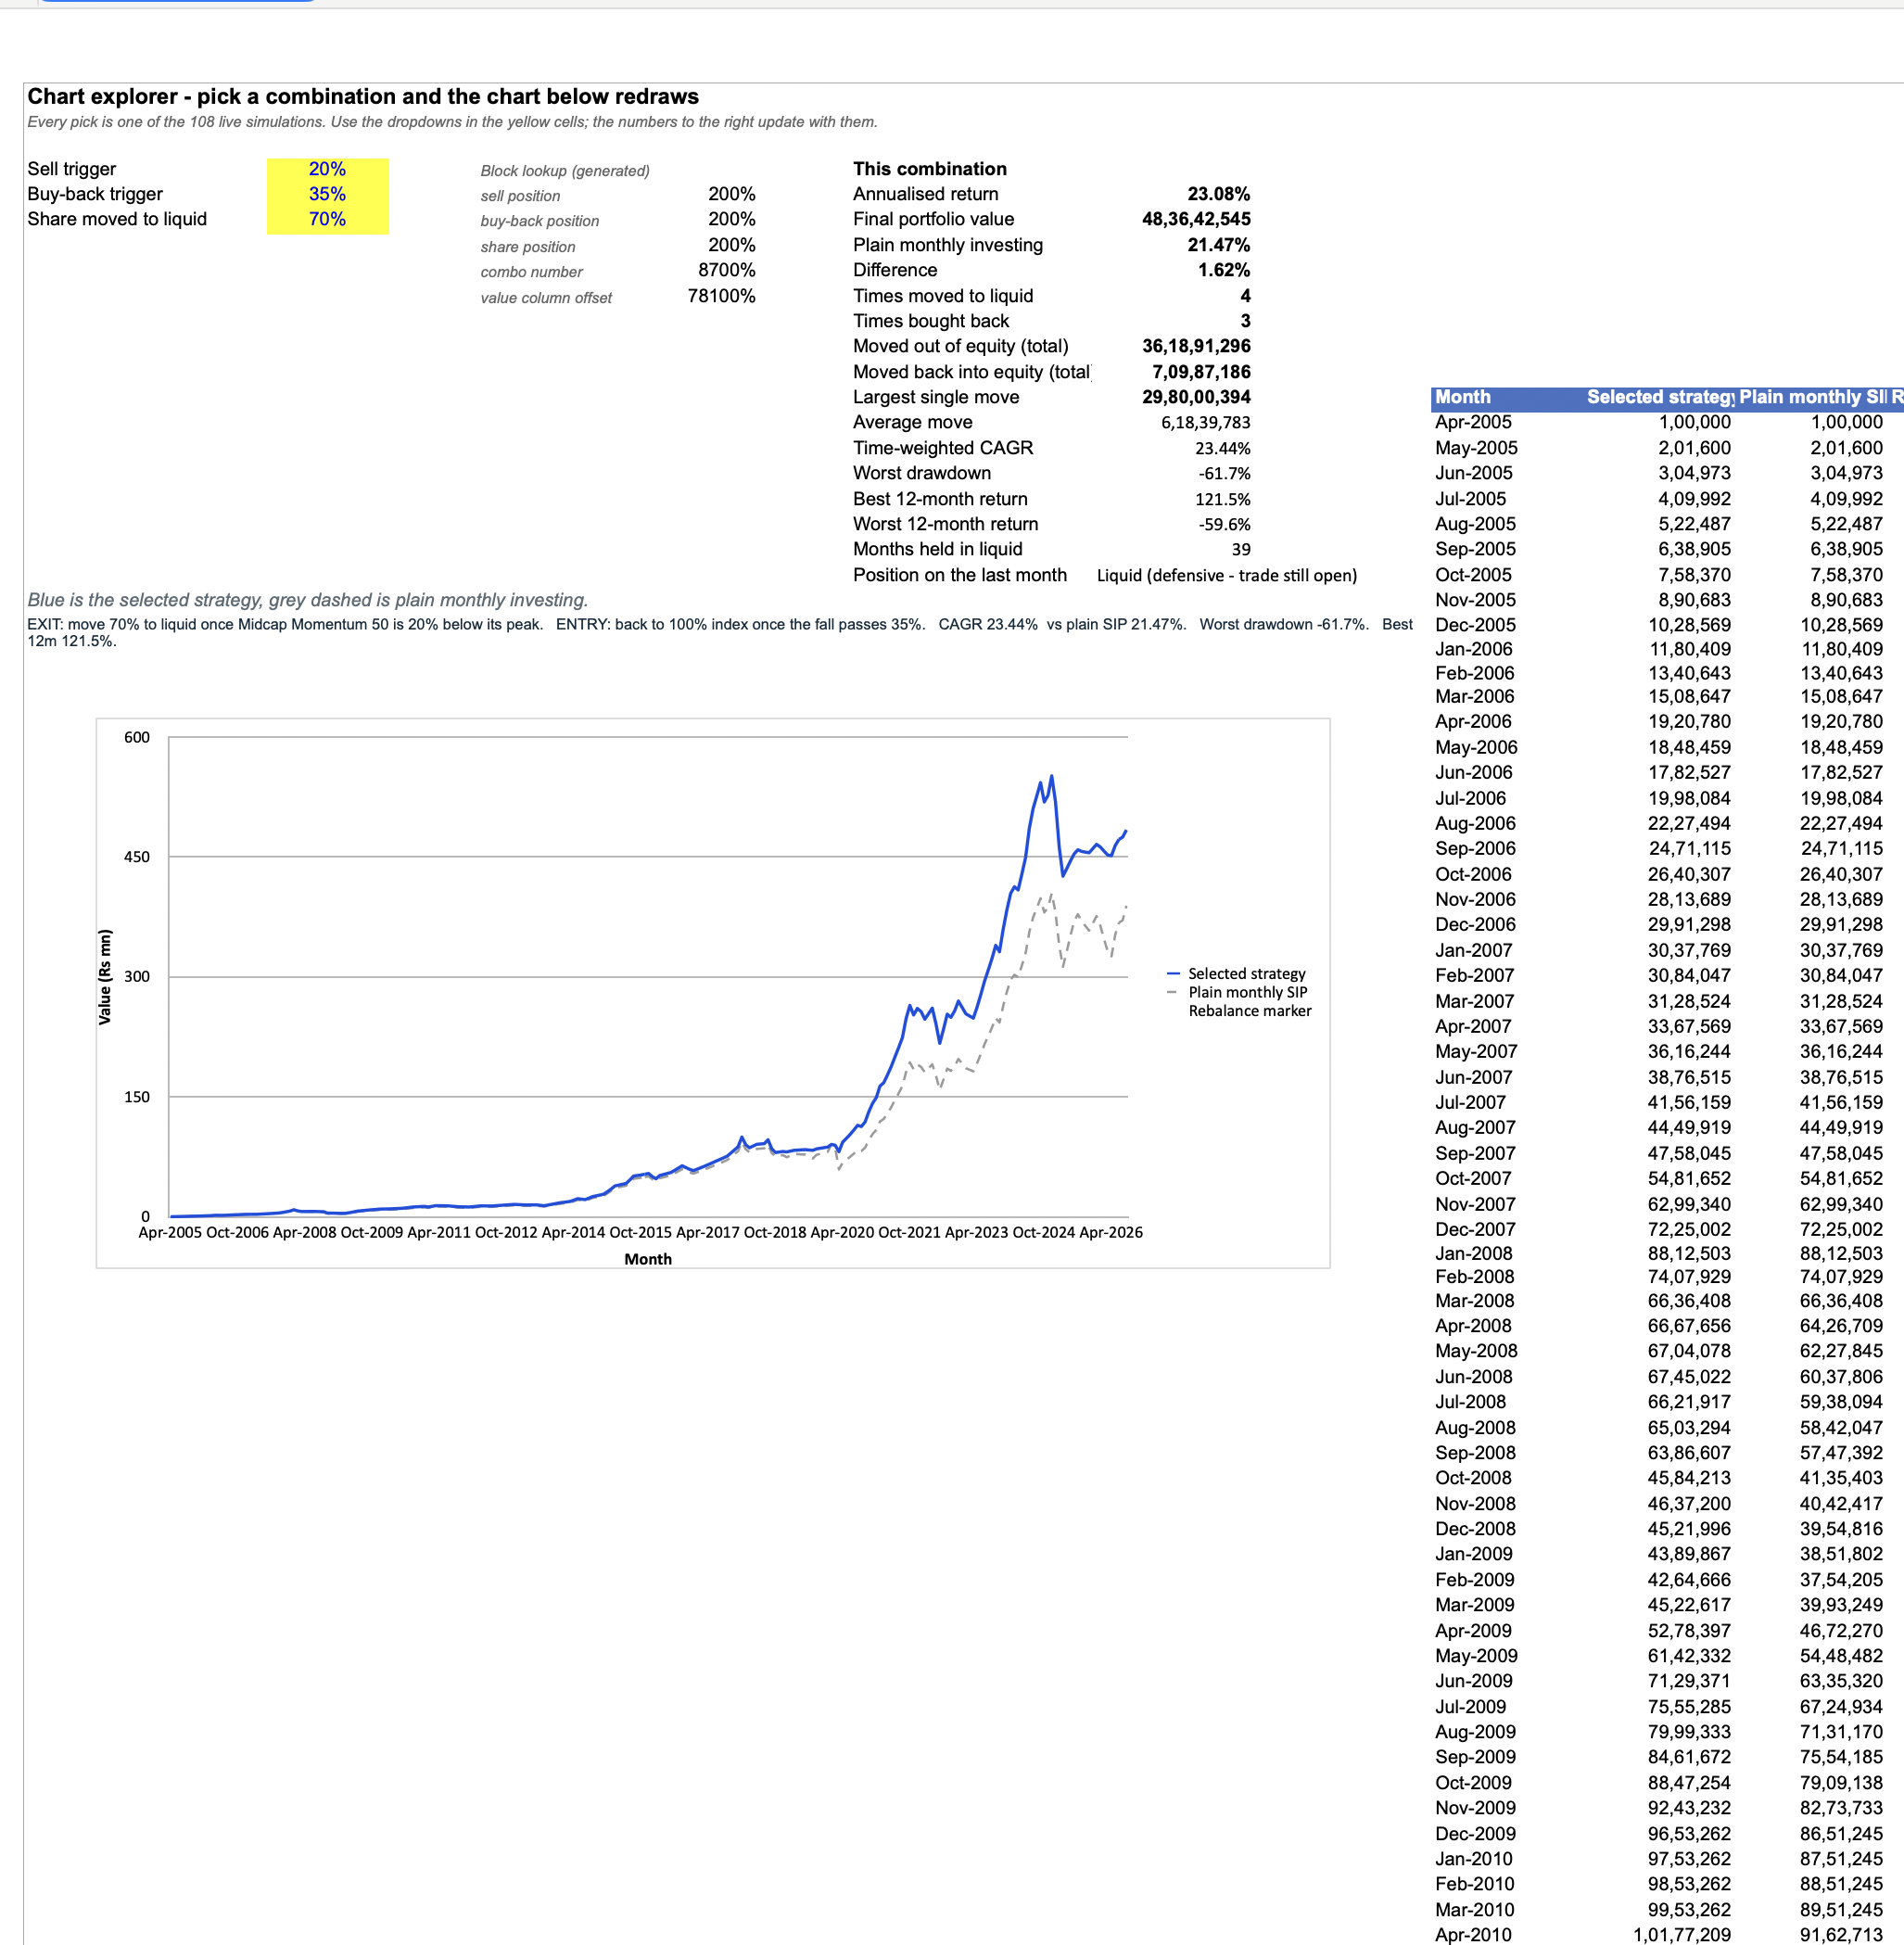
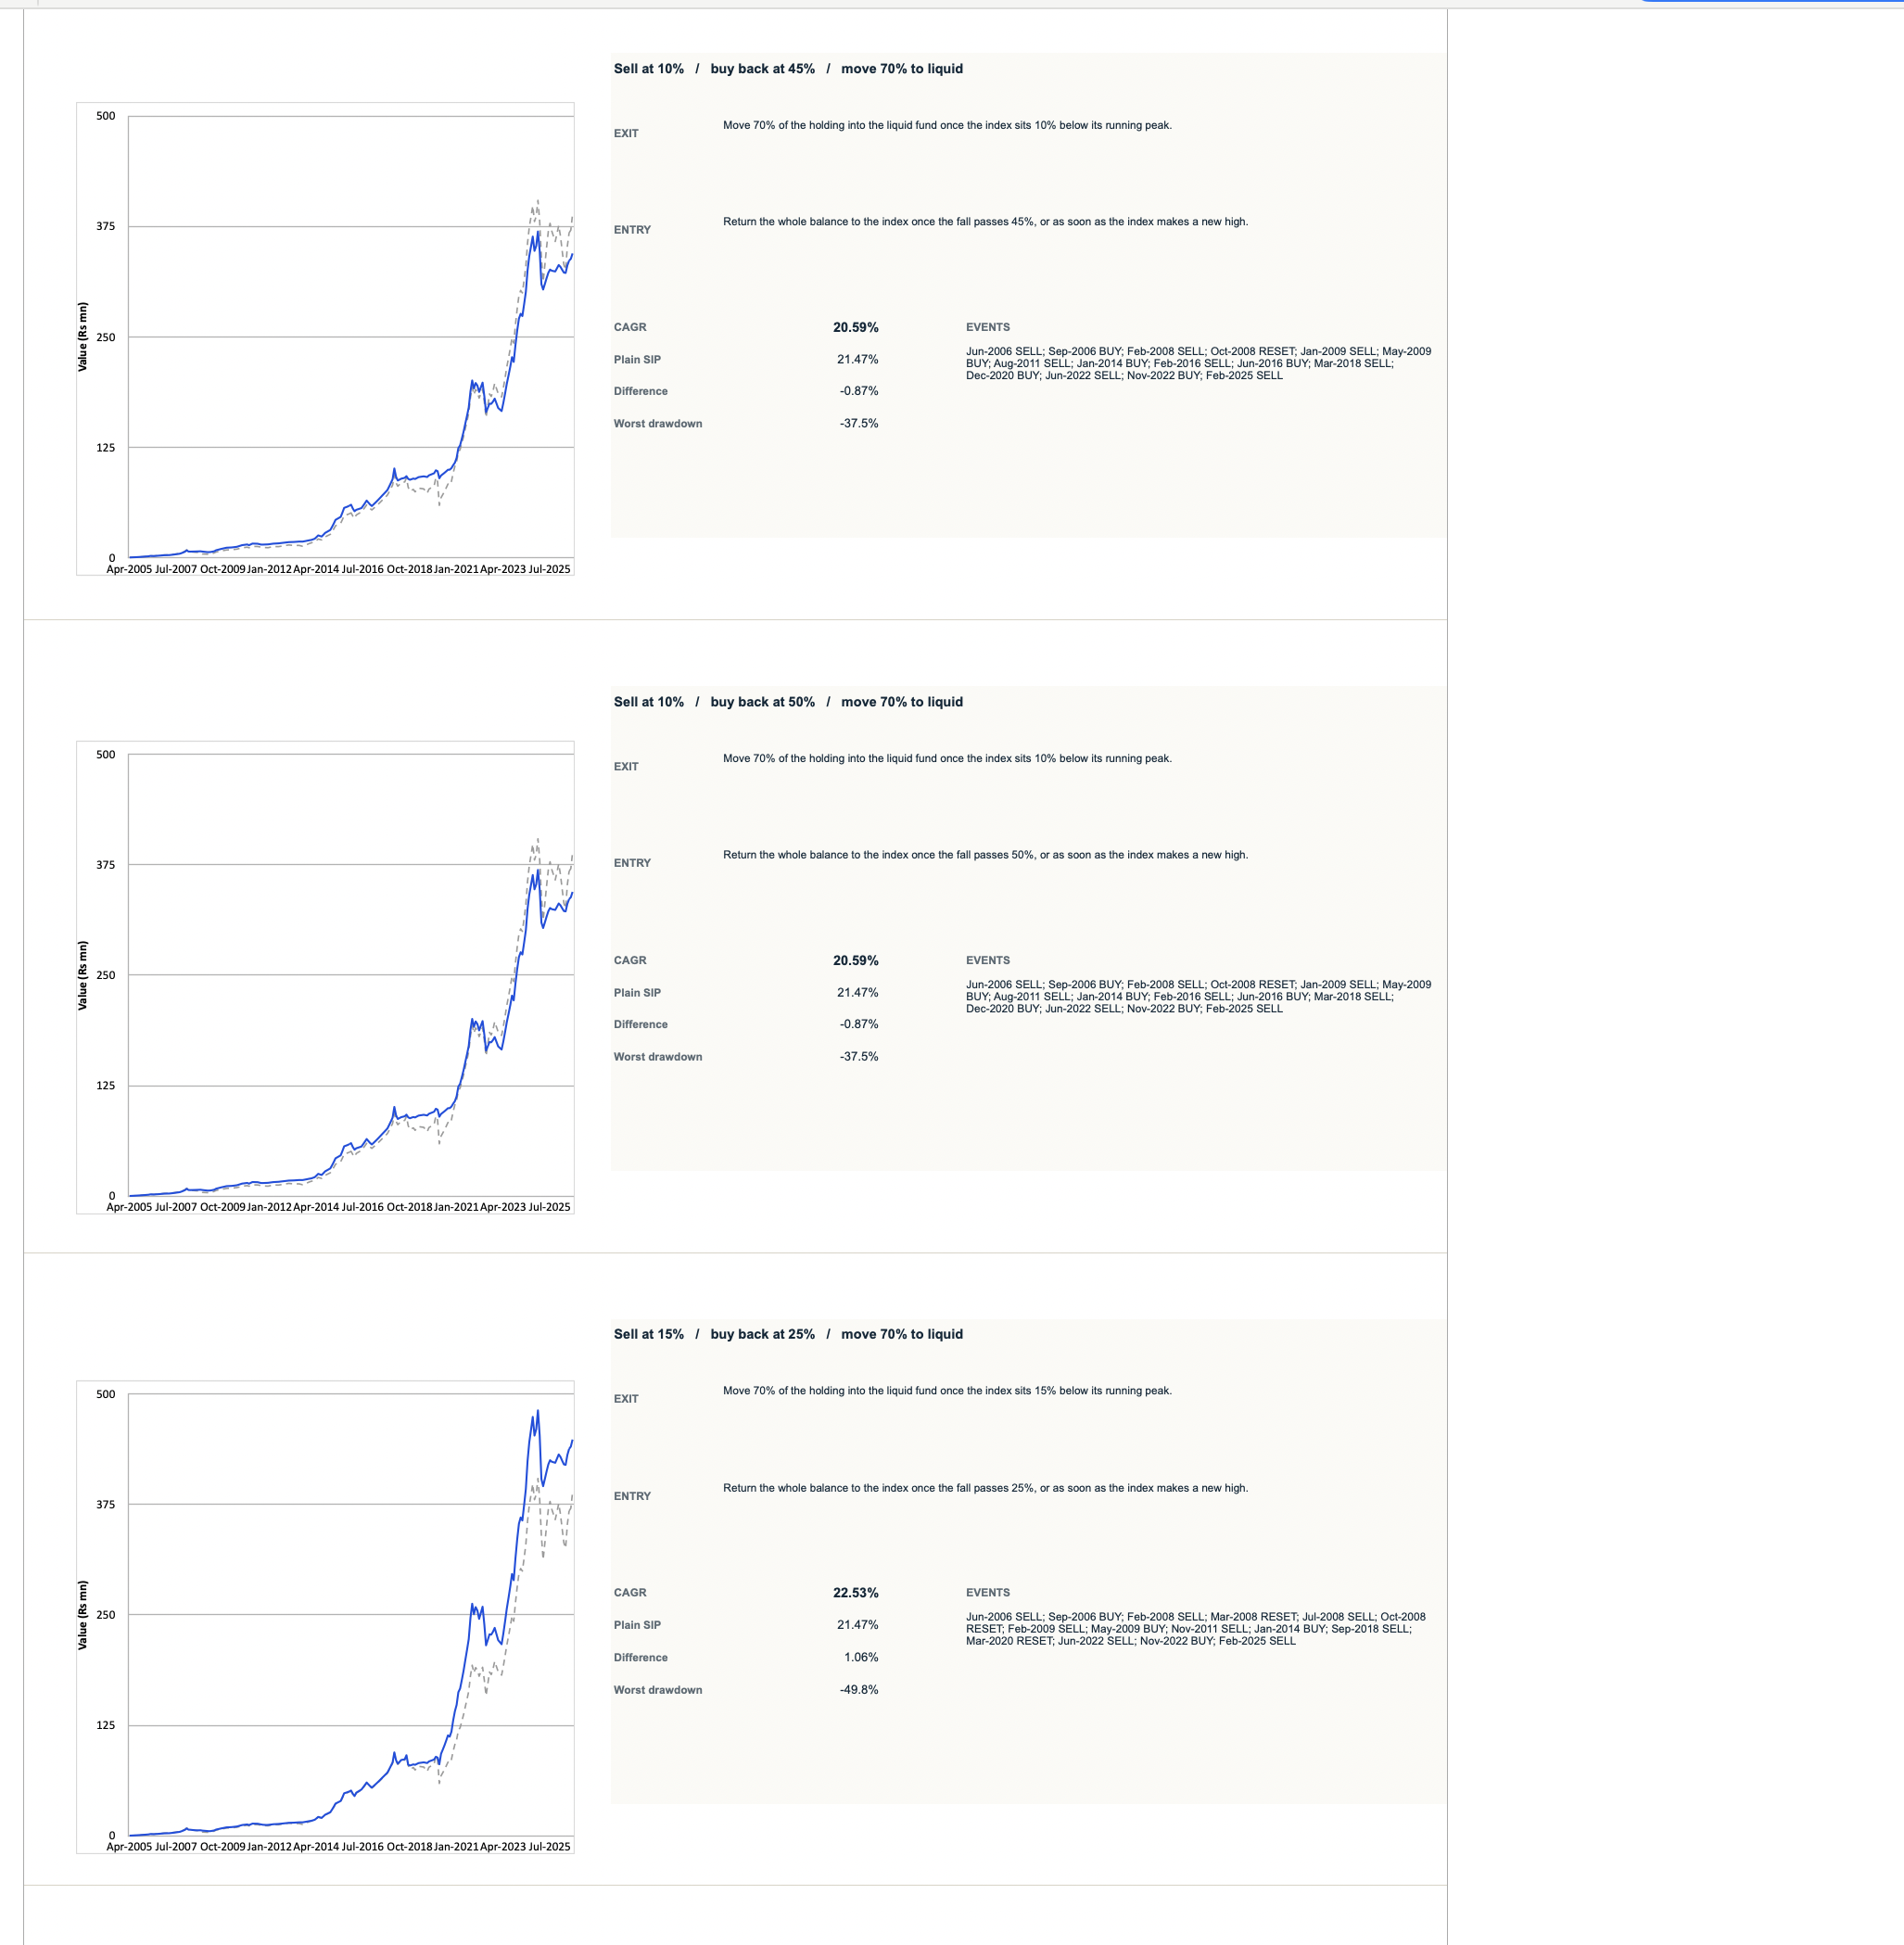
An Excel-based backtesting strategy simulator for indices and stocks. Test how swing strategies actually would have played out — and find the combinations that generate returns at low beta rather than just riding high beta up and down.
One price, everything
Backtesting strategy simulator
₹999 one time
- Know whether stepping aside in a fall actually beats staying invested — before you try it with your own money
- See the worst fall each strategy puts you through, so you pick one you can actually sit through without panicking
- Run it on your own fund, index or stock — a chart screenshot is enough to start
- Change one number and get the answer straight away. No coding, no analyst, no waiting
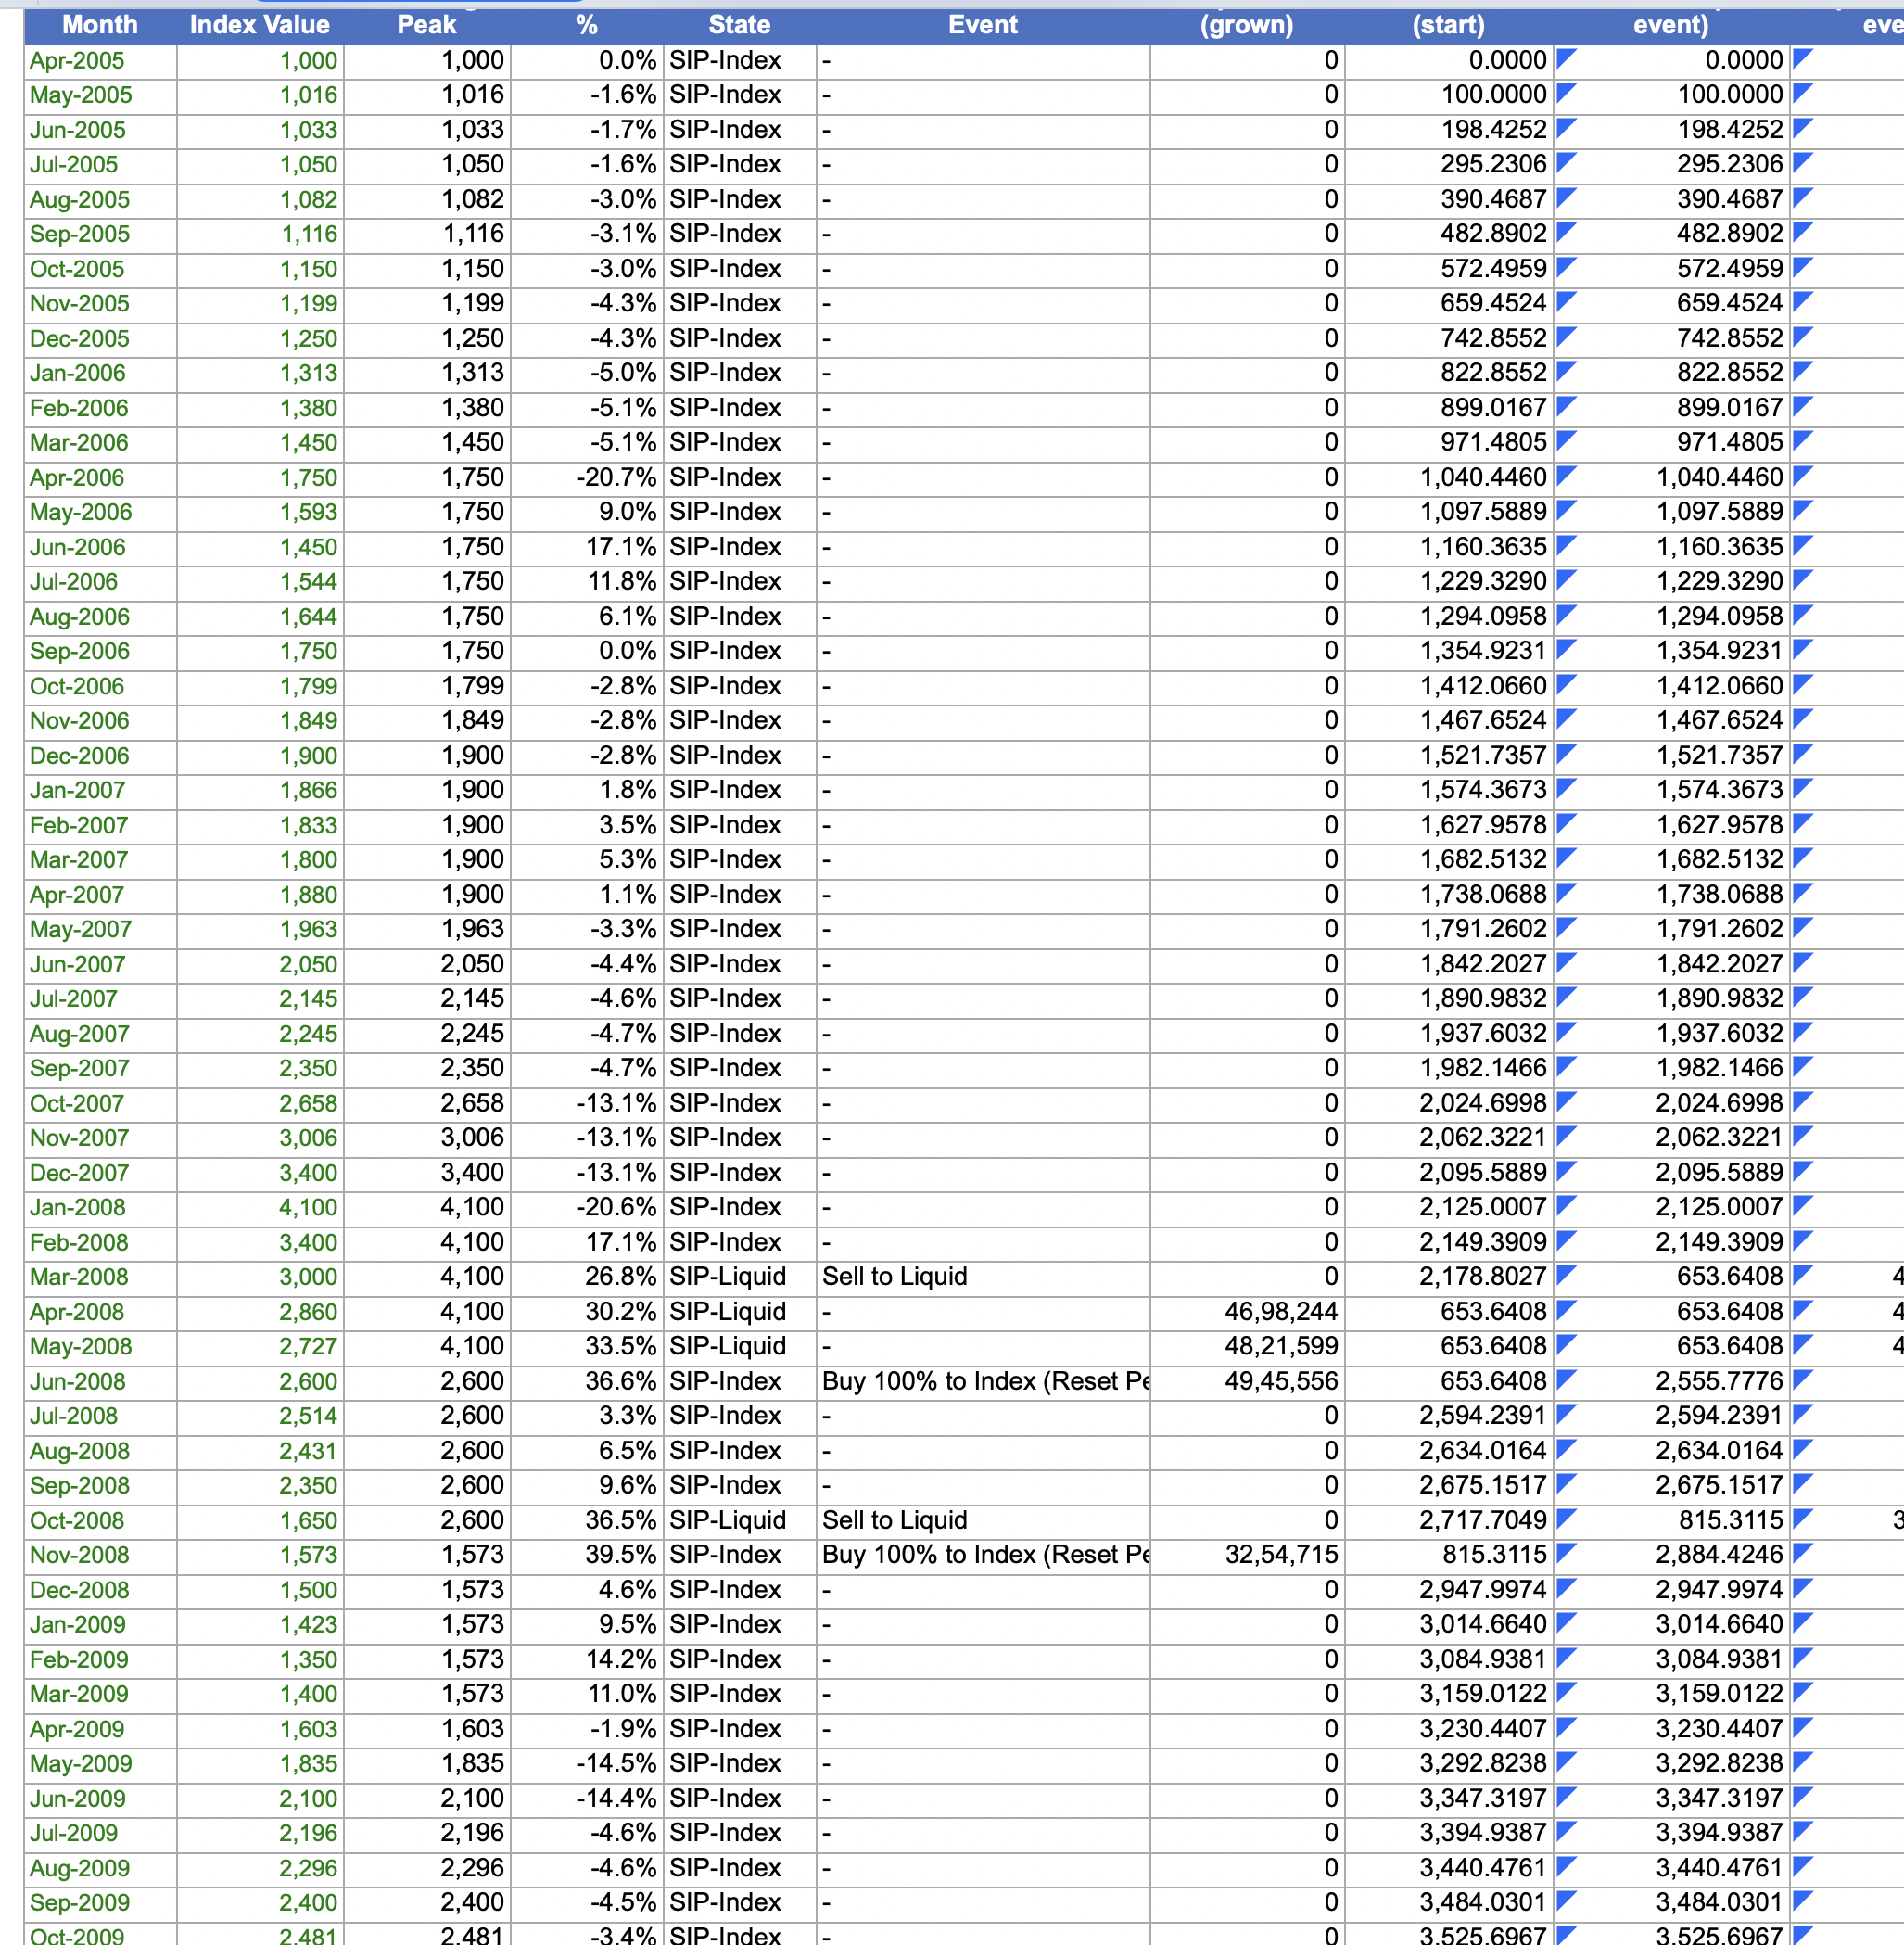
- Check the working yourself — every formula is open, so nothing has to be taken on trust